What Are AI Infographics? Definition and Use Cases
Content
ToggleInfographics are static, often data-driven visualizations that translate complex information into easily digestible graphics. They follow standardized design patterns:
Typical Elements:
- Icons and pre-made symbols
- Explanatory text
- Charts (bar graphs, pie charts, timelines)
- Focus on numbers and statistics
- Clear hierarchical structure
- Primarily used for marketing or content purposes
Real-World Example: An AI tool like Google Gemini (generative image creation “Nano Banana Pro”) can automatically generate an infographic from a YouTube video—with minimalist design, numbered steps, and generic icons. This works perfectly for:
- Social media content
- Blog posts with statistics
- Process checklists (e.g., “7 Steps to Productivity”)

The limitation: Infographics visualize existing knowledge. They don’t create new insights. AI graphics are always retrospective, while graphic recordings capture what’s happening in real-time—for example, during a group discussion.
1. Do I already have the solution? → Infographic is sufficient (e.g., for content marketing)
2. Does my team need to develop the solution first? → Graphic recording in a workshop
3. Should the result remain effective for months? → Strategy visual with a visual consultant
Rule of thumb: If you'll still need the image in a few weeks or months to align your team—invest in expert visualization.

AI Tools, Strategy Visualization & Graphic Recording: The Difference
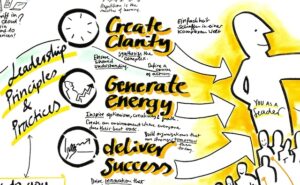
Strategy visualizations are context-specific process tools created through careful strategic thinking (e.g., Rich Pictures, strategy visuals) or created live (e.g., graphic recording). They emerge through dialogue with your team and capture not just data, but dynamics.
The Core Differences:
| Dimension | Infographic (AI-generated) | Strategy Visual (consultant-led) | Graphic Recording (live) |
|---|---|---|---|
| Content | Static data/facts | complex synthesis out of the results of month long processes | Emergent ideas, conflicts, real-time dynamics |
| Process | Automated, template-based | Iterative consulting over weeks | Live-Facilitation, Co-Creation |
| Goal | Convey information | Activate strategy, align organization. | Facilitate consensus, capture workshop |
| Format | automated | Step 1 in the facilitated meeting, followed by feedback loops and planned rollout/launch | exclusively in live situations (meetings, workshops) |
| Timeframe | wenige Minuten | Days/weeks (with feedback loops) | few hours up to 3 days |
| Degree of complexity | Depending on the level of AI development, simple to moderate, no synthesis possible, no context for result relevance. | Extremely high is possible, depending on the goal of change communication. | High, especially when presenting, interdependency, and networking of even contradictory perspectives, as well as classifying what is relevant to results and what is not. |
Specifically, this means (examples):
- Infographic: “How change management works (in general)”
- Graphic recording: “Why is our change project failing—and what do we need to do?”
- Strategy image: “How we reach our employees and ensure a coherent impact on the organization”
A graphic recording in a strategy workshop captures:
- The arguments actually discussed (not idealized processes)
- Lines of conflict between stakeholders
- Sudden twists and dynamics
- Quiet but important voices vs. meeting participants who prefer to hear themselves talk
- Metaphors that resonate in your corporate context
Real-life example: In a strategy workshop for a medium-sized company, our visual facilitator develops a live “navigation system” metaphor for digital transformation—because the CEO had previously said, “We’re driving in fog.” This metaphor becomes the common thread for the next twelve months. AI would have spit out a generic “change roadmap” template.

Detail from a visualization: AI implementation at a client
Why AI Tools Like Nano Banana Pro Fall Short
AI-generated infographics (z. B. via Gemini, Toth, Skywork, etc.) are impressive—but unsuitable for strategic visualizations and graphic recording. Here are four structural limitations::
1. Lack of Context Sensitivity
❌ AI processes transcripts (text), not subtext and other forms of communication
✅ Experts also read energy in the room, body language, pauses, unspoken tensions, and much more
Example: In a C-level meeting, an argument breaks out over budgets. The visual facilitator visualizes the conflicts of interest behind the numbers—not just the numbers themselves.
2. No Active Facilitation
❌ AI infographics are end products
✅ Live visualizations are process-accompanying interventions that guide dialogue-based work
For instance: When the visualizer consciously places an idea larger/more centrally, it signals importance. Teams adjust their discussion. AI tools have no facilitation function.
3. Template Thinking vs. Individual Sense-Making
❌ AI uses icon libraries
✅ Experts develop unique metaphors (e.g., “your company as a sailboat in a storm”)
The difference: Generic icons are quickly forgotten. A custom metaphor becomes the common language of your leadership team.
4. Dynamic Adaptation Impossible
❌ AI generates, you iterate externally
✅ Experts adapt live: “Ah, that’s different now—let me redraw that” (in real-time)
From practice: In a strategy visual concept workshop, ideas evolve. The strategy communication grows with them—no need for 40 AI iterations.
The 5 Core Competencies of Human Visualization Experts
What makes a visual facilitator irreplaceable?
1. Strategic Listening
- Filters the most important points from hours of discussion
- Recognizes patterns that participants themselves don’t notice
- Translates jargon into universal but perfectly fitting images
2. Process Steering
- Decides in real-time: “This topic needs more space”
- Slows down/accelerates discussions through visual prioritization
- Creates safe spaces for controversial perspectives
3. Metaphor Engineering
- Develops sense-making images that work for your culture
- Example: Family business → “Tree with roots,” or startup → “Rocket on mission flight”
- Can link different metaphors together
4. Consensus Architecture
- Makes the abstract tangible → faster agreements
- Creates a synthesis from highly complex, nested, and disconnected information worlds
- Visualizes dissent respectfully (not: who’s right or louder, but: multiple perspectives visible)
5. Sustainable Impact
- The image becomes an anchor in the change process
- A strategy visual can activate, ensure, and support process implementation (for months)
- Employees say, for example: “Remember the workshop—the ship must hold course now!”
These competencies are the result of 100,000+ hours of facilitation experience from hundreds of visual facilitators worldwide — no AI will replicate this in 2026.
When to Use Which Method? Decision Guide for Leaders
| Situation | Infographic (AI Tool) | Strategy Visual (Consultant) | Graphic Recording (Expert) |
|---|---|---|---|
| Marketing-Content | ✅ Perfect | ❌ Overkill | ❌ Live-creation unnecessary |
| Interne Prozess-Dokumentation | ✅ Fast & scalable | 🔶 Optional | 🔶 To create clarity |
| Strategie-Workshop | ❌ Too generic | ✅ Essential | ✅ Essential |
| Change-Kommunikation | ❌ No emotional depth | ✅ Creates commitment | ✅ For meetings and workshops |
| Entwicklung von Werten, Mission, Vision | ❌ Template thinking | ✅ Facilitates consensus | ✅ Core application |
| Stakeholder-Alignment | ❌ No moderation | ✅ Core application | ✅ To create clarity |
• 6 months delayed implementation = ~$85,000 (opportunity costs)
• 3 follow-up meetings due to misunderstandings = ~$16,000 (C-level time)
• 20% team turnover due to unclear direction = ~$130,000 (recruiting/onboarding)
→ Total: ~$231,000
Investment in visual facilitation:
• 2-day strategy workshop with expert = ~$8,500-16,000
• ROI with only 40% avoidance of above costs = ~$92,000 saved
Bottom line: Strategy visualization isn't an expense—it's risk mitigation with 5-10x return.

The 80/20 Rule for Visual Strategies:
Deploy expert visualization for the 20% high-impact moments:
- Strategy retreats
- Transformation kickoffs
- C-level alignment sessions
- Culture engineering (values, vision, mission)
For the 80% standard content work? Use AI tools. But never confuse data visualization with strategy work.
Conclusion: Technology Complements, Doesn’t Replace.
AI tools like Nano Banana Pro (Gemini) democratize infographic design—which is great for content marketing. But when it comes to strategic clarity, consensus, and sustainable transformation, you need human expertise.
The reason is simple: Strategy visualization isn’t automation of knowledge. It’s facilitation of thinking.
You’ve invested months and tens or hundreds of thousands of dollars in developing your strategy. Don’t leave it to a $20 tool to visualize it.
Next Steps for Your Team:
- Quick Win: Use AI tools for social media or blog content. But caution: Prompting for first-class results and your own style sometimes requires weeks of training, so everything doesn’t look redundant and generic like every other user of the same AI tool.
- Strategic Investment: Book a visual facilitator for your next strategy retreat.
- Strategy Activiation: Work with visual consultants who ensure the message truly lands in the organization — permanently.
- Hybrid Approach: Let the expert work live — use AI tools for follow-up content from the workshop.
Ready to experience the difference yourself? Contact us for a no-obligation strategy conversation — we’ll show you how visualization accelerates your next transformation (this is especially powerful in the current AI chaos).
About VISUAL FACILITATORS:
We’ve been developing strategy visualizations for mid-market companies and consulting firms in Europe and the Middle East for over 20 years. Our methods: Graphic recording, rich pictures, visual strategy mapping — always live, always context-specific, always with measurable impact on decision-making speed. And: We’re pioneers in combining strategy activation with AI.
FAQ
AI image generators like Midjourney/Gemini create images after the workshop (from notes). A visual facilitator works during the process—the visualization is part of the workshop, not the minutes.
A failed change process costs six figures and more (time, motivation, opportunity cost). A 2-day workshop with visualization costs a fraction — and increases implementation rates by 40-60%.
Typical for a strategy visual: several days, but distributed over a few weeks (to allow space for feedback loops). For simple meetings or culture workshops, graphic recording (live documentation) is often sufficient, with half-day to 3-day deployments depending on meeting duration.
Yes and no. What comes out with normal use is generic, often seen (redundant), and in a style everyone recognizes. Highly professional prompting and AI training, as VISUAL FACILITATORS has done, takes months and is a lengthy learning process. The result—a unique style, outstanding quality, error-free—isn’t something you can just achieve by prompting yourself.
People are (unconsciously) currently unlearning what’s real and true, and seeing lots of content that’s fake and false. Add to that the hurdles of an often non-human-centered, purely technical AI implementation. Working with VISUAL FACILITATORS helps connect genuine handcraft with strategic topics and gives people stability and security.